Building Tomorrow's Infrastructure Today: A Data-Driven System for Strategic National Development
The Challenge
Infrastructure drives national progress—yet in the Philippines, planning remains fragmented and reactive. Despite billions in annual investments, the same problems persist year after year: chronic flooding in metro areas, deteriorating roads in the provinces, overcrowded schools, under-resourced hospitals, and uneven regional development that leaves some areas thriving while others fall further behind.
The root cause? Data silos. Critical government agencies operate in isolation:
PSA holds population growth data
DepEd and CHED track education service access
DOH monitors health facility capacity
DTI measures economic activity
DPWH manages infrastructure projects
These datasets exist in different formats, use inconsistent region codes, and rarely speak to each other. The result is infrastructure planning based on political pressure or intuition rather than evidence—leading to mismatched priorities, recurring crises, and billions of pesos that don't deliver maximum national impact.
This capstone project asks a fundamental question: Where should the Philippines focus infrastructure investments to support regions that are rapidly urbanizing, growing in population, and accelerating development?
Our Approach: InfraWatch
InfraWatch is an innovative, integrated multi-agency infrastructure prioritization system that demonstrates how modern data engineering can transform Philippine development planning. Our Batch 11 capstone group built an end-to-end analytics pipeline that breaks down data silos and provides decision-makers with a unified view of national infrastructure needs.
The InfraWatch Data Framework
We developed a comprehensive scoring matrix across five critical dimensions:
Population Growth & Pressure – Tracking demographic shifts from 76M to 113M (50% growth), identifying regions facing the greatest infrastructure strain
Economic Development – Mapping GDP contribution and urbanization rates to understand where economic activity is concentrated
Social Service Availability – Measuring gaps in education (school density vs. enrollment growth) and healthcare (hospital density vs. population)
Transportation Infrastructure – Analyzing road density, bridge conditions, and vehicle volume to identify mobility bottlenecks
Disaster Risk Exposure – Overlaying multi-hazard risk data with population density to find vulnerable regions
By integrating these five indicators into a single Priority Index, InfraWatch enables evidence-based infrastructure planning that aligns investments with actual regional needs.
Technical Architecture
Our modern data engineering pipeline demonstrates sophisticated integration across government agencies:
Data Collection & Ingestion
Python Selenium web scraper for DPWH infrastructure projects
dlt (data load tool) pipelines for PSA, DepEd, CHED, DOH, DTI, and PDC datasets
Automated data completeness verification and format validation
Storage & Transformation
ClickHouse cloud data warehouse for scalable storage
dbt staging models for data standardization
dbt transformation models resolving region name inconsistencies across agencies
Data quality checks and duplicate detection at every stage
Analytics & Visualization
Tableau dashboard with regional clustering analysis
Standalone .twbx extracts for distribution to stakeholders
Interactive Priority Index visualization for scenario planning
This reproducible pipeline can be updated annually as new government data becomes available, creating a living infrastructure intelligence system.
Key Findings
Our analysis revealed stark patterns of infrastructure mismatch across the Philippines:
1. Population Pressure is Intensifying
The Philippines has grown by 50%—from 76 million to 113 million people—creating unprecedented infrastructure pressure. Three regions dominate this growth:
NCR, Region IV-A (CALABARZON), and Region III (Central Luzon) account for 56% of national economic output in 2024
These same regions show the highest urban population growth rates from 2010 to 2024
Yet infrastructure investment hasn't kept pace with this concentration of economic activity
2. Social Services Lag Behind Population Growth
Critical gaps in education and healthcare are emerging in high-growth regions:
Healthcare Gaps:
BARMM shows rapid population growth but critically low hospital density
NIR (Negros Island Region) and Region VI (Western Visayas) show similar healthcare underservice patterns
Growing populations are outpacing the expansion of health facilities
Education Strain:
Regions VII (Central Visayas), XI (Davao), and X (Northern Mindanao) face high enrollment growth with low school density
Schools are becoming overcrowded while new construction lags behind demand
3. Transportation Infrastructure Shows Geographic Divides
Road and bridge conditions reveal two distinct challenges:
Urban Congestion:
NCR experiences extreme vehicle volume with deteriorating road conditions
94% of Philippine bridges are in good condition, but most poor-quality bridges concentrate in BARMM, NCR, CAR, and Region IV-A
Rural Isolation:
BARMM, CAR (Cordillera), Region II (Cagayan Valley), and Region XII (SOCCSKSARGEN) have low road densities due to geographic challenges and dispersed populations
Regions VI (Western Visayas) faces poor road conditions despite lower traffic volumes
4. Disaster Vulnerability Compounds Infrastructure Gaps
The most vulnerable regions face a double burden:
Less populated regions show the highest multi-hazard exposure risk
These same regions often have the lowest infrastructure investment, making them both disaster-vulnerable and infrastructure-poor
Climate resilience must be integrated into infrastructure planning, not treated as a separate concern
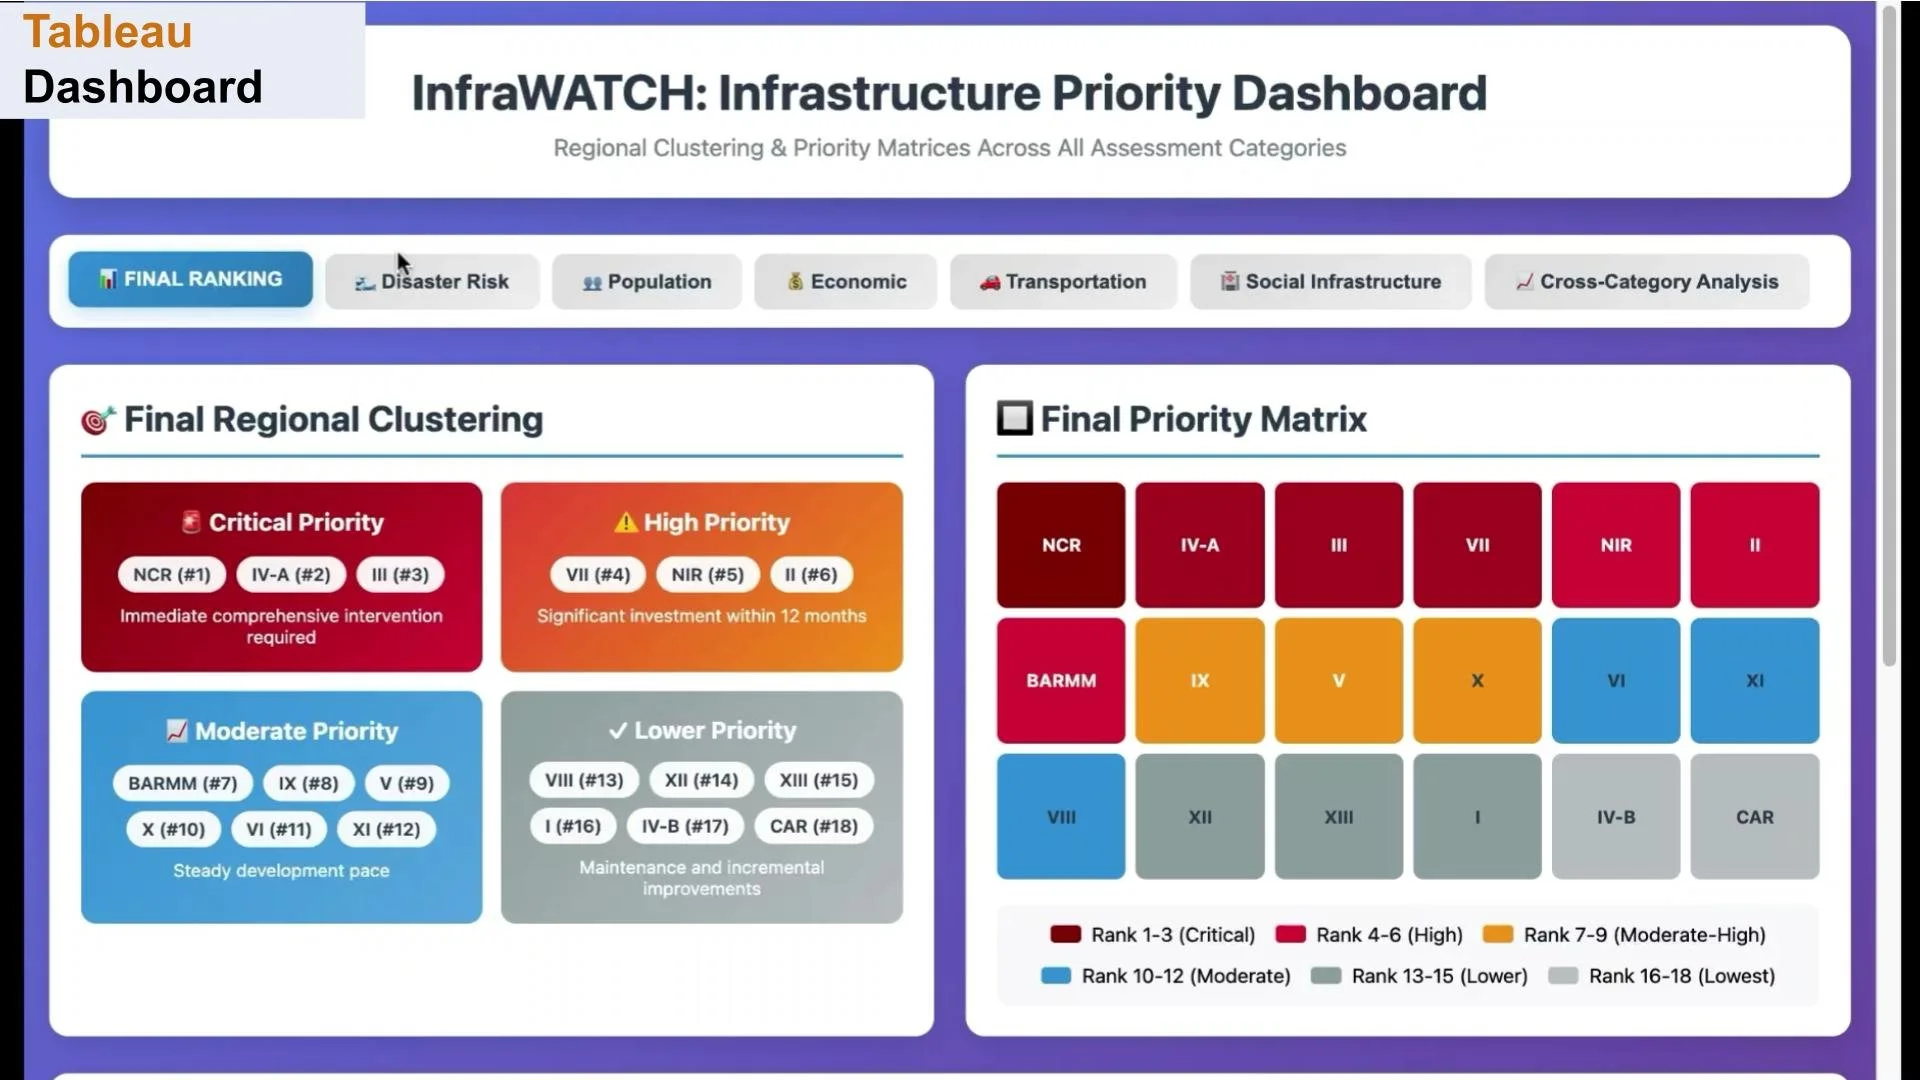
Geographic Clustering: Four Regional Profiles
Our Priority Index analysis identified distinct regional clusters:
High-Priority Urban Centers – NCR, IV-A, III requiring immediate capacity expansion
Emerging Economic Zones – Regions experiencing rapid growth but under-resourced
Service-Gap Regions – Areas with adequate population but insufficient social services
Vulnerable Frontiers – Disaster-prone regions needing resilient infrastructure
Impact & Recommendations
InfraWatch provides actionable intelligence for the Department of Public Works and Highways (DPWH), National Economic and Development Authority (NEDA), and regional planners. Our system enables:
1. Institutionalize a Unified Infrastructure Prioritization Framework
Adopt InfraWatch's approach as a complementary tool for consolidating PSA, DPWH, DTI, DOH, DepEd, and CHED datasets to support coordinated, cross-agency planning. This proof-of-concept demonstrates how modern data stacks can enhance existing government systems.
2. Align Budget Allocation to Data-Driven Priority Regions
Use the InfraWatch Priority Index to guide DPWH capital investments in the next budget cycle. Focus on high-growth regions that are currently underserved—particularly those showing population pressure without corresponding infrastructure expansion.
3. Standardize Region Codes Across All Government Agencies
Develop a shared region mapping dictionary to eliminate data inconsistencies. The technical challenge of mismatched region names across PSA, DepEd, CHED, and DPWH datasets wastes analyst time and introduces errors—this is solvable with standardization.
4. Deploy InfraWatch Insights to Regional DPWH Offices
Empower regional planners with dashboard access so they can validate local needs and submit stronger, data-backed project proposals. Bottom-up planning works best when local offices have the same analytical tools as national headquarters.
5. Integrate Predictive Analytics in Future System Updates
Expand InfraWatch with forecasting models that anticipate future infrastructure pressure from population surges, economic expansion, and climate change impacts. Move from reactive to proactive planning.
Why This Matters
Every year, the Philippine government invests billions of pesos in infrastructure. Without a unified, data-driven prioritization system, those investments risk being driven by political considerations rather than national need. Roads get built where they're least needed. Hospitals remain understaffed in high-growth regions. Schools become overcrowded while construction happens elsewhere.
InfraWatch shifts infrastructure planning from intuition-based to evidence-based. It answers the question every planner should ask: Where will each peso of infrastructure investment create the greatest national impact?
By integrating data from seven government agencies into a single analytics pipeline, this project demonstrates how modern data engineering can enhance coordination and evidence-based planning in Philippine infrastructure development. The technology exists. The data exists. What's demonstrated here is a proof-of-concept for breaking down silos and planning for the Philippines as a unified whole.
This capstone shows what's possible when talented Filipinos are given the skills to tackle problems that matter. InfraWatch isn't just a student project—it's a blueprint for how the Philippines can build smarter, spend better, and develop more equitably.