From Reactive to Resilient: Transforming Disaster Preparedness in the Philippines
The Challenge
The Philippines ranks among the world's most disaster-prone nations. Typhoons, earthquakes, floods, and landslides strike with devastating regularity, claiming lives and destroying livelihoods. Yet our approach to disaster preparedness remains fundamentally unfair: Local Government Units (LGUs) receive disaster funds based on their revenue capacity, not their actual risk or need.
Under current rules, LGUs must allocate 5% of their revenue to the Local Disaster Risk Reduction and Management Fund (LDRRMF). This sounds reasonable—until you realize what it means in practice:
Wealthy provinces with low disaster risk receive large budgets they often fail to spend
Poor provinces facing extreme climate threats receive inadequate funding precisely when they're most vulnerable
Fund allocation is disconnected from reality: revenue capacity has no relationship to typhoon paths, earthquake zones, or flood plains
The result? A disaster preparedness system that reinforces inequality rather than building resilience. This capstone project asks a fundamental question: How can Philippine LGUs allocate disaster risk management funds more equitably—based on actual need rather than revenue capacity?
Our Approach: A Risk-Based Framework
Our Batch 11 capstone group built a comprehensive data-driven budgeting framework that replaces wealth-based allocation with risk-based allocation. By integrating climate science, demographic data, infrastructure assessments, and fund utilization records, we created a system that answers the question: Which provinces need disaster preparedness support most urgently?
The Disaster Risk Scorecard Methodology
We developed a multi-dimensional assessment framework across three critical pillars:
1. Hazard Exposure – What disasters threaten each province?
Multi-hazard exposure index from Pacific Disaster Center (PDC)
Climate risk classifications across typhoons, earthquakes, floods, landslides
Historical disaster damage costs from NDRRMC (2017-2022)
2. Vulnerability – How susceptible are communities to disaster impacts?
Poverty incidence from PSA (2018-2023 average)
Population density from PhilAtlas
Clean water access vulnerability (coastal provinces show the lowest access)
Forest cover loss from Global Forest Watch (e.g., Agusan del Sur lost 28,880 hectares—equivalent to the entire area of Metro Manila)
3. Coping Capacity – How prepared are provinces to respond?
Evacuation center availability vs. population needs
Fire station coverage (target: 1 per 20,000 population)
Road infrastructure density
Internet connectivity for emergency communications
Healthcare facility access
By combining these dimensions into a composite Disaster Risk Score, we can identify provinces that face the deadliest combination: high hazard exposure, high vulnerability, and low coping capacity.
Technical Architecture
Our modern data engineering pipeline integrated disparate government data sources:
Data Collection & Ingestion
API scraping from PSA for demographics, poverty, and literacy
Web scraping for healthcare facilities, evacuation centers, fire stations
PDF extraction from Bureau of Local Government Finance for LDRRMF budgets
Forest cover data from Global Forest Watch
Climate risk data from Pacific Disaster Center
Python and dlt (data load tool) for automated collection
Storage & Transformation
Cloud data warehouse for centralized storage
dbt (data build tool) for creating standardized provincial scorecards
Min-max normalization to combine indicators across different scales
Quality validation to ensure data consistency across 82 provinces
Analytics & Visualization
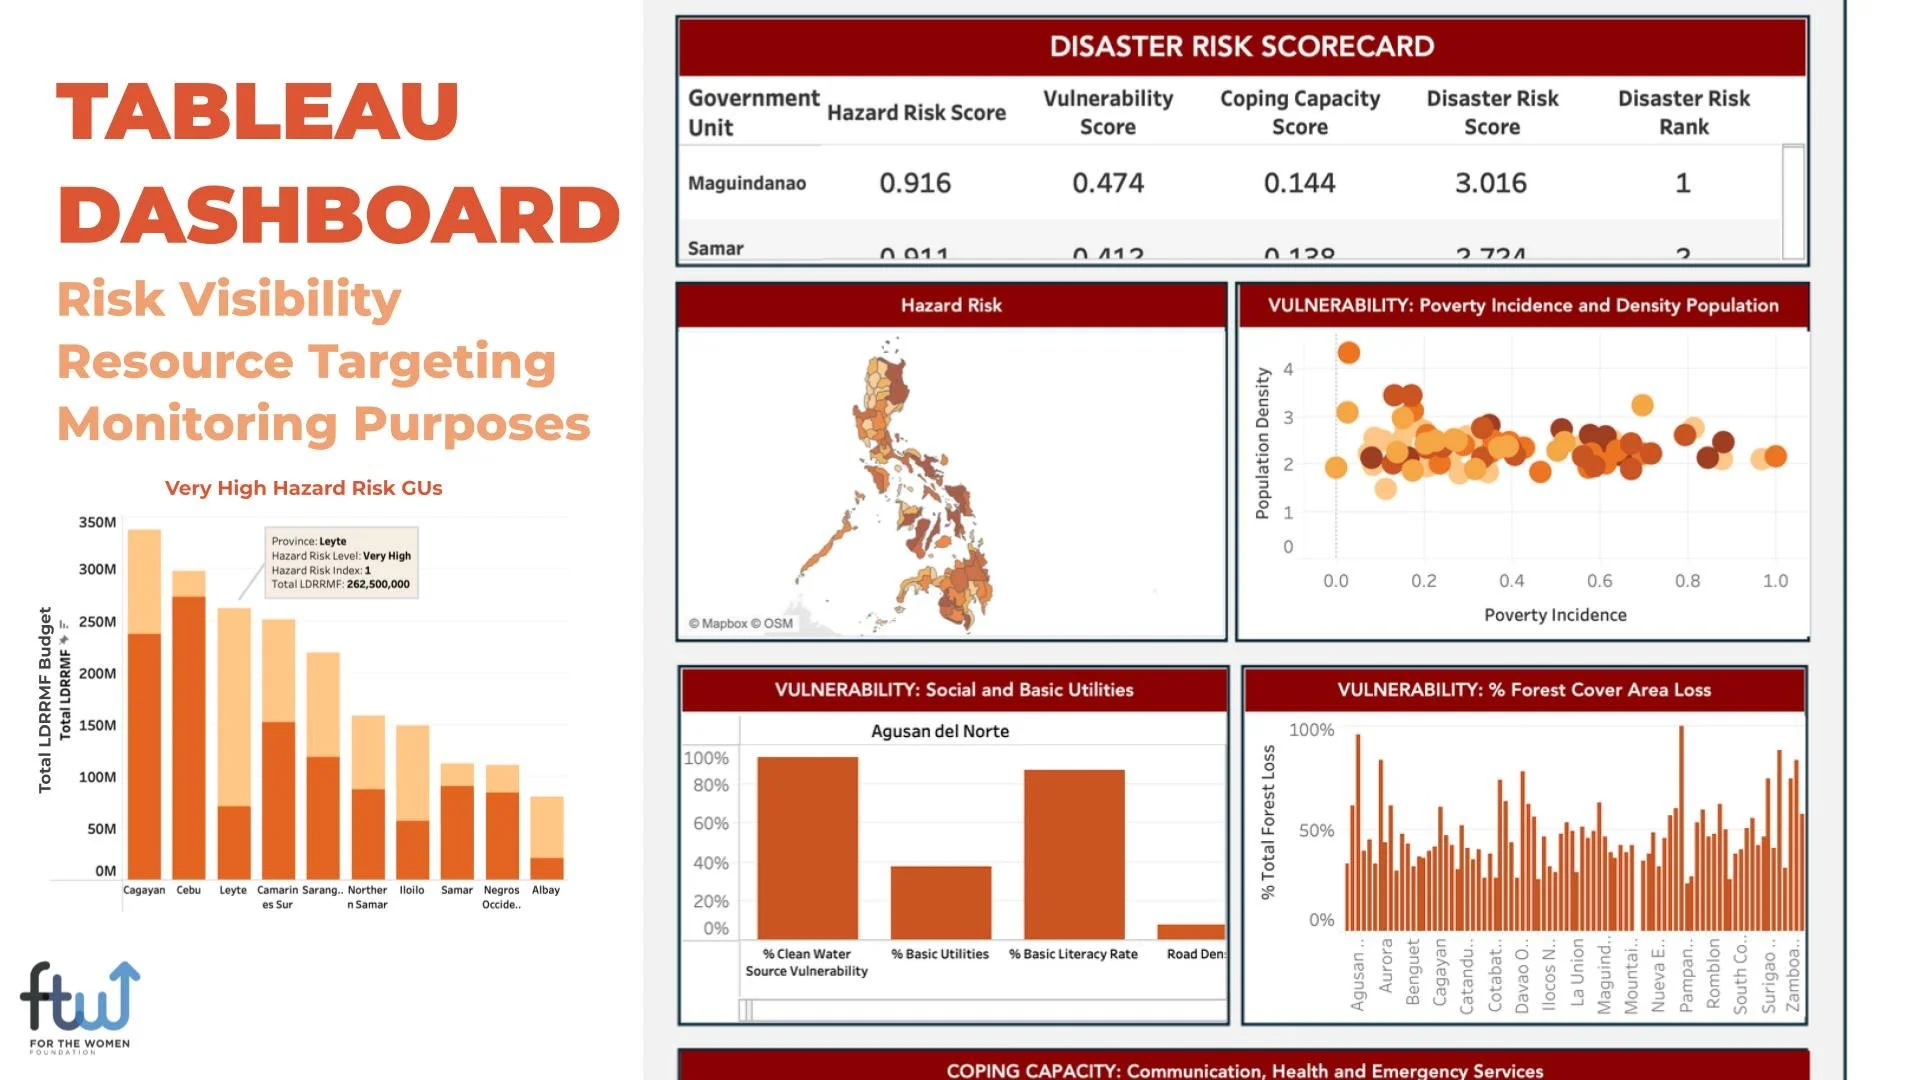
Interactive Tableau dashboard showing risk scores, vulnerability patterns, and fund utilization
Scenario simulation tools for testing allocation models
Real-time monitoring of provincial risk profiles
This reproducible system can be updated annually as new disaster data, population figures, and infrastructure investments become available.
Key Findings
Our analysis revealed stark patterns of disaster preparedness inequality across the Philippines:
1. Geographic Risk Disparity: The Most Vulnerable Provinces
Maguindanao, Samar, and Leyte emerge as the highest-risk provinces, combining:
Very high hazard exposure to multiple disaster types
Elevated vulnerability from poverty and limited infrastructure
Low coping capacity due to insufficient emergency resources
This deadly combination spans from Luzon to Mindanao, showing that disaster risk is not concentrated in one region—it's a nationwide challenge requiring targeted, data-driven responses.
2. Critical Preparedness Gaps in High-Risk Provinces
Infrastructure deficits leave vulnerable populations exposed:
70-80% of high-risk provinces fall below evacuation center requirements—when disasters strike, there's literally nowhere safe to go
25-40% lack minimum fire station coverage—failing to meet the 1 per 20,000 population standard
76% have limited road infrastructure—making emergency response and evacuation difficult
Weak internet connectivity—hampering early warning systems and disaster coordination
These aren't abstract statistics. They represent families trapped in flood zones without evacuation options, communities facing fires without adequate response capacity, and provinces unable to coordinate emergency responses because communication systems fail.
3. Vulnerability is the Critical Difference
A striking comparison reveals why vulnerability matters:
Cebu vs. Leyte:
Both provinces have similar hazard exposure levels
Both have comparable coping capacity
Yet Leyte ranks 3rd in disaster risk (2.54) while Cebu ranks 12th (1.63)
What explains the difference? Vulnerability. Leyte's higher poverty incidence, lower infrastructure density, and greater population exposure create a multiplier effect—the same typhoon that Cebu can weather becomes catastrophic for Leyte.
This finding challenges simplistic disaster planning that focuses only on hazard maps. Resilience requires addressing the underlying socioeconomic factors that make some provinces more susceptible than others.
4. The Fund Underutilization Paradox
Perhaps the most puzzling finding: both very high and very low hazard risk LGUs significantly underutilize their allocated LDRRMF budgets.
This isn't a funding shortage problem—it's a governance and capacity problem:
High-risk provinces may lack technical capacity to plan and execute preparedness projects
Low-risk provinces see disaster funds as abstract requirements, not urgent priorities
Bureaucratic hurdles slow disbursement even when needs are clear
Lack of clear guidance on what constitutes effective preparedness spending
The current system fails twice: it allocates funds inequitably, and those funds aren't being used effectively even when available.
5. Clean Water Vulnerability Concentrates in Coastal Provinces
Coastal provinces show the least access to clean water, creating compounded disaster vulnerability:
When typhoons strike coastal areas, contaminated water supplies become a secondary disaster
Waterborne disease outbreaks follow floods and storm surges
Disaster response must include water purification capacity, not just evacuation
This finding highlights why disaster preparedness must be holistic—addressing pre-existing vulnerabilities that disasters will amplify.
6. Deforestation Amplifies Disaster Risk
Agusan del Sur lost 28,880 hectares of forest cover—an area equivalent to the entire Metro Manila. This isn't just an environmental issue; it's a disaster multiplier:
Deforested watersheds increase flood risk
Exposed hillsides become landslide zones
Lost forest buffers reduce natural disaster protection
High-risk provinces need integrated strategies that connect reforestation, watershed management, and disaster preparedness.
Impact & Recommendations
This framework provides actionable intelligence for the National Disaster Risk Reduction and Management Council (NDRRMC), Department of Interior and Local Government (DILG), Department of Budget and Management (DBM), and provincial DRRM officers across all 82 provinces.
1. Adopt Risk-Based Allocation Beyond the 5% Rule
Replace the revenue-based formula with the Disaster Risk Scorecard methodology. Allocate LDRRMF based on composite risk scores that account for hazard exposure, vulnerability, and coping capacity—not provincial wealth.
This doesn't mean wealthy provinces get nothing; it means allocation is proportional to need. A low-risk, high-capacity province might receive baseline funding, while Maguindanao or Leyte receive substantially more to close critical preparedness gaps.
2. Deploy the Dashboard as the Primary Decision Support Tool
Implement the Local Disaster Risk Dashboard for NDRRMC, DILG, and all provincial DRRM offices. The dashboard enables:
Risk Visibility: Instantly see which provinces face the highest multi-dimensional risk
Resource Targeting: Identify specific infrastructure gaps (evacuation centers, fire stations, roads)
Continuous Monitoring: Track annual changes in provincial risk profiles
Dashboard-driven decision making replaces ad hoc planning with systematic, evidence-based allocation.
3. Build Dynamic, Context-Adapted Scorecards
Customize the framework for local contexts:
Allow provinces to adjust indicator weights based on their specific risk profiles (e.g., earthquake-prone vs. typhoon-prone regions)
Enable scenario simulation: "What if we invest in 10 more evacuation centers? How does our risk score change?"
Track vulnerability and coping capacity shifts over time to measure preparedness improvement
A static scorecard becomes outdated quickly. A dynamic system keeps pace with changing risks and evolving capacity.
4. Strengthen National Disaster Data Infrastructure
Develop a unified national disaster data portal:
Coordinate data across NDRRMC, PSA, DILG, DBM, and PDC
Standardize provincial and municipal codes so datasets can integrate seamlessly
Require detailed LDRRMF expenditure reporting with line-item breakdowns
Address the fund underutilization crisis:
Provide technical assistance to high-risk provinces with low capacity
Establish clear guidelines on effective preparedness spending
Create accountability mechanisms to track outcomes, not just disbursements
Data infrastructure isn't glamorous, but it's foundational. Without standardized, accessible data, evidence-based planning remains impossible.
5. Integrate the Framework into National and Local Planning Cycles
Operationalize this framework by embedding it into existing systems:
Make the scorecard methodology part of the annual budget planning process
Require provinces to reference their risk scores when submitting LDRRMF proposals
Use dashboard insights to inform NDRRMC policy recommendations
The goal isn't to create another parallel system—it's to enhance and inform existing governance structures with better data.
Why This Matters
Every year, the Philippines loses lives, homes, and economic productivity to disasters that were predictable and, to a significant degree, preventable. We know which provinces face the highest risks. We know which communities lack evacuation centers, fire stations, and emergency infrastructure. We know that poverty and deforestation amplify disaster impacts.
What we've lacked is a systematic way to translate that knowledge into equitable resource allocation.
The current 5% revenue rule treats disaster preparedness as a tax rather than a strategic investment. Wealthy provinces treat it as a budgeting exercise while poor, vulnerable provinces scramble to prepare with inadequate resources. This framework flips the logic: allocate resources where they will save the most lives and build the greatest resilience.
By replacing wealth-based allocation with risk-based allocation, we can transform the Philippines from a nation that reacts to disasters to one that builds proactive resilience. This isn't just better budgeting—it's a matter of climate justice. The provinces least responsible for climate change face the greatest impacts. The provinces with the fewest resources need the most support.
The Path Forward
This capstone demonstrates that the technical capability exists to implement fair, data-driven disaster budgeting. Our Batch 11 group built a working prototype using publicly available data and open-source tools. The question isn't whether it's possible—it's whether we have the political will to prioritize equity and resilience over administrative inertia.
The dashboard is ready. The methodology is proven. The data is available. Now it's up to policymakers to adopt a system that ensures disaster preparedness resources reach the provinces that need them most—before the next typhoon makes landfall.